Posts

NIFTY SMALLCAP 100 INDEX WEEKLY CHART ANALYSIS

Image
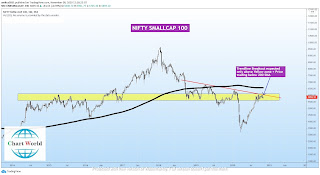
 NIFTY SMALLCAP 100 INDEX WEEKLY CHART ANALYSIS In the above chart we can see that, Trend line Breakout expected only above Yellow zone + Price trading below 200 SMA. Nifty Smallcap 100 Index Stocks List Company Name Aegis Logistics Ltd. Affle (India) Ltd. Alok Industries Ltd. Amber Enterprises India Ltd. Aster DM Healthcare Ltd. Avanti Feeds Ltd. BASF India Ltd. BEML Ltd. Bajaj Electricals Ltd Balrampur Chini Mills Ltd. Bharat Dynamics Ltd. Birla Corporation Ltd. Blue Star Ltd. CSB Bank Ltd. Can Fin Homes Ltd. Ceat Ltd. Central Depository Services (India) Ltd. Century Plyboards (India) Ltd. Century Textile & Industries Ltd. Chambal Fertilizers & Chemicals Ltd. Cochin Shipyard Ltd. Cyient Ltd. DCB Bank Ltd. DCM Shriram Ltd. Deepak Nitrite Ltd. Delta Corp Ltd. Dilip Buildcon Ltd. Dixon Technologies (India) Ltd. E.I.D. Parry (India) Ltd. Engineers India Ltd. Equitas Holdings Ltd. FDC Ltd. Firstsource Solutions Ltd. GMM Pfaudler Ltd. Godfrey Phillips India Ltd. Granules India Lt

NIFTY MIDCAP 100 INDEX WEEKLY CHART ANALYSIS

Image
 NIFTY MIDCAP 100 INDEX WEEKLY CHART ANALYSIS In the above chart we can see that,  Trend line Breakout done + Weekly closing above 200 SMA. Now 18500 is near resistance. Nifty Midcap 100 Index Stocks List Company Name AU Small Finance Bank Ltd. Aarti Industries Ltd. Adani Enterprises Ltd. Adani Gas Ltd. Aditya Birla Capital Ltd. Aditya Birla Fashion and Retail Ltd. Ajanta Pharmaceuticals Ltd. Alembic Pharmaceuticals Ltd. Amara Raja Batteries Ltd. Apollo Hospitals Enterprise Ltd. Apollo Tyres Ltd. Ashok Leyland Ltd. Balkrishna Industries Ltd. Bank of India Bata India Ltd. Bharat Electronics Ltd. Bharat Forge Ltd. Bharat Heavy Electricals Ltd. Bombay Burmah Trading Corporation Ltd. CESC Ltd. Canara Bank Castrol India Ltd. Cholamandalam Investment and Finance Company Ltd. City Union Bank Ltd. Coforge Ltd. Coromandel International Ltd. Crompton Greaves Consumer Electricals Ltd. Cummins India Ltd. Dalmia Bharat Ltd. Dhani Services Ltd. Dr. Lal Path Labs Ltd. Edelweiss Financial Services L

NIFTY FMCG INDEX WEEKLY CHART ANALYSIS

Image
 NIFTY FMCG INDEX WEEKLY CHART ANALYSIS If we see in this above chart, we can observe the Symmetrical pattern formation is going on if we ignore the march 20 fall in market. Consolidation going in symmetrical triangle pattern. After breakout price will try to touch the upper trend line of rising wedge pattern. Nifty FMCG Index Stocks List Company Name Britannia Industries Ltd. Colgate Palmolive (India) Ltd. Dabur India Ltd. Emami Ltd. Godrej Consumer Products Ltd. Hindustan Unilever Ltd. ITC Ltd. Jubilant Foodworks Ltd. Marico Ltd. Nestle India Ltd. Procter & Gamble Hygiene & Health Care Ltd. Tata Consumer Products Ltd. United Breweries Ltd. United Spirits Ltd. Varun Beverages Ltd. DISCLAIMER : -  I AM NOT SEBI REGISTERED ANALYST. DO YOUR OWN ANALYSIS BEFORE TAKING ANY TRADE OR CONSULT YOUR ADVISER BEFORE TAKING ANY TRADE. THIS DATA IS ONLY FOR EDUCATIONAL PURPOSE & PAPER TRADE. SHARE MARKET IS SUBJECT TO MARKET RISK. I AM NOT RESPONSIBLE FOR YOUR ANY LOSS OR PROFIT. Link

NIFTY PHARMA INDEX WEEKLY CHART ANALYSIS

Image
 NIFTY PHARMA INDEX WEEKLY CHART ANALYSIS Clear uptrend we can see in this chart. Price trading above all important SMA + Chart structure is very clear. We can expect the new high in this in coming weeks/months. Nifty Pharma Index stocks list Company Name Alkem Laboratories Ltd. Aurobindo Pharma Ltd. Biocon Ltd. Cadila Healthcare Ltd. Cipla Ltd. Divi's Laboratories Ltd. Dr. Reddy's Laboratories Ltd. Lupin Ltd. Sun Pharmaceutical Industries Ltd. Torrent Pharmaceuticals Ltd. DISCLAIMER : -  I AM NOT SEBI REGISTERED ANALYST. DO YOUR OWN ANALYSIS BEFORE TAKING ANY TRADE OR CONSULT YOUR ADVISER BEFORE TAKING ANY TRADE. THIS DATA IS ONLY FOR EDUCATIONAL PURPOSE & PAPER TRADE. SHARE MARKET IS SUBJECT TO MARKET RISK. I AM NOT RESPONSIBLE FOR YOUR ANY LOSS OR PROFIT. Link to Join Telegram channel  -   https://t.me/chartworldat

NIFTY NEXT 50 INDEX WEEKLY CHART ANALYSIS

Image
 NIFTY NEXT 50 INDEX WEEKLY CHART ANALYSIS In the above chart we can see that, Trend line breakout done + Price closed above 200 SMA.  But Upper trend line is now work as near resistance NIfty Next 50 Stock List Company Name ACC Ltd. Abbott India Ltd. Adani Green Energy Ltd. Adani Transmission Ltd. Alkem Laboratories Ltd. Ambuja Cements Ltd. Aurobindo Pharma Ltd. Avenue Supermarts Ltd. Bajaj Holdings & Investment Ltd. Bandhan Bank Ltd. Bank of Baroda Berger Paints India Ltd. Bharti Infratel Ltd. Biocon Ltd. Bosch Ltd. Cadila Healthcare Ltd. Colgate Palmolive (India) Ltd. Container Corporation of India Ltd. DLF Ltd. Dabur India Ltd. General Insurance Corporation of India Godrej Consumer Products Ltd. HDFC Asset Management Company Ltd. Havells India Ltd. Hindustan Petroleum Corporation Ltd. Hindustan Zinc Ltd. ICICI Lombard General Insurance Company Ltd. ICICI Prudential Life Insurance Company Ltd. Indraprastha Gas Ltd. Info Edge (India) Ltd. InterGlobe Aviation Ltd. Larsen & Tou

NIFTY INDIA CONSUMPTION INDEX WEEKLY CHART ANALYSIS

Image
 NIFTY INDIA CONSUMPTION INDEX WEEKLY CHART ANALYSIS Above red line resistance breakout expected. Nifty India Consumption Index Stocks list Company Name Alkem Laboratories Ltd. Apollo Hospitals Enterprise Ltd. Asian Paints Ltd. Avenue Supermarts Ltd. Bajaj Auto Ltd. Berger Paints India Ltd. Bharti Airtel Ltd. Britannia Industries Ltd. Colgate Palmolive (India) Ltd. Crompton Greaves Consumer Electricals Ltd. Dabur India Ltd. Godrej Consumer Products Ltd. Havells India Ltd. Hero MotoCorp Ltd. Hindustan Unilever Ltd. ITC Ltd. InterGlobe Aviation Ltd. Jubilant Foodworks Ltd. Mahindra & Mahindra Ltd. Marico Ltd. Maruti Suzuki India Ltd. Nestle India Ltd. Page Industries Ltd. Tata Consumer Products Ltd. Titan Company Ltd. Trent Ltd. United Breweries Ltd. United Spirits Ltd. Voltas Ltd. Zee Entertainment Enterprises Ltd. DISCLAIMER : -  I AM NOT SEBI REGISTERED ANALYST. DO YOUR OWN ANALYSIS BEFORE TAKING ANY TRADE OR CONSULT YOUR ADVISER BEFORE TAKING ANY TRADE. THIS DATA IS ONLY FOR ED

NIFTY COMMODITIES INDEX WEEKLY CHART ANALYSIS

Image
 NIFTY COMMODITIES INDEX WEEKLY CHART ANALYSIS In the above chart we can see that, Trend line Breakout done but weekly closing must be above yellow zone + 200 SMA for next up move. Nifty Commodities Index stocks list Company Name ACC Ltd. Aarti Industries Ltd. Adani Green Energy Ltd. Ambuja Cements Ltd. Atul Ltd. Bharat Petroleum Corporation Ltd. Coal India Ltd. Coromandel International Ltd. Dalmia Bharat Ltd. Grasim Industries Ltd. Hindalco Industries Ltd. Hindustan Petroleum Corporation Ltd. Hindustan Zinc Ltd. Indian Oil Corporation Ltd. JSW Steel Ltd. Jindal Steel & Power Ltd. NHPC Ltd. NMDC Ltd. NTPC Ltd. Oil & Natural Gas Corporation Ltd. PI Industries Ltd. Pidilite Industries Ltd. Reliance Industries Ltd. Shree Cement Ltd. Tata Power Co. Ltd. Tata Steel Ltd. The Ramco Cements Ltd. Torrent Power Ltd. UPL Ltd. UltraTech Cement Ltd. DISCLAIMER : -  I AM NOT SEBI REGISTERED ANALYST. DO YOUR OWN ANALYSIS BEFORE TAKING ANY TRADE OR CONSULT YOUR ADVISER BEFORE TAKING ANY TRADE.

NIFTY AUTO INDEX WEEKLY CHART ANALYSIS

Image
 NIFTY AUTO INDEX WEEKLY CHART ANALYSIS We will see trend line breakout above yellow zone + Price may try to touch the 200 SMA in coming weeks. Right now price is taking support of blue trend line & 100 SMA. Nifty Auto Index Stocks List Company Name Amara Raja Batteries Ltd. Ashok Leyland Ltd. Bajaj Auto Ltd. Balkrishna Industries Ltd. Bharat Forge Ltd. Bosch Ltd. Eicher Motors Ltd. Exide Industries Ltd. Hero MotoCorp Ltd. MRF Ltd. Mahindra & Mahindra Ltd. Maruti Suzuki India Ltd. Motherson Sumi Systems Ltd. TVS Motor Company Ltd. Tata Motors Ltd. DISCLAIMER : -  I AM NOT SEBI REGISTERED ANALYST. DO YOUR OWN ANALYSIS BEFORE TAKING ANY TRADE OR CONSULT YOUR ADVISER BEFORE TAKING ANY TRADE. THIS DATA IS ONLY FOR EDUCATIONAL PURPOSE & PAPER TRADE. SHARE MARKET IS SUBJECT TO MARKET RISK. I AM NOT RESPONSIBLE FOR YOUR ANY LOSS OR PROFIT. Link to Join Telegram channel  -   https://t.me/chartworldat

NIFTY METAL INDEX WEEKLY CHART ANALYSIS

Image
  NIFTY METAL INDEX WEEKLY CHART ANALYSIS In the above chart we can see that, trend line breakout happen on weekly chart + Falling wedge pattern breakout done. Now near resistance is yellow zone and red trend line. Nifty Metal Index Stocks list Company Name APL Apollo Tubes Ltd. Coal India Ltd. Hindalco Industries Ltd. Hindustan Copper Ltd. Hindustan Zinc Ltd. JSW Steel Ltd. Jindal Steel & Power Ltd. MOIL Ltd. Mishra Dhatu Nigam Ltd. NMDC Ltd. National Aluminium Co. Ltd. Ratnamani Metals & Tubes Ltd. Steel Authority of India Ltd. Tata Steel Ltd. Welspun Corp Ltd. DISCLAIMER : -  I AM NOT SEBI REGISTERED ANALYST. DO YOUR OWN ANALYSIS BEFORE TAKING ANY TRADE OR CONSULT YOUR ADVISER BEFORE TAKING ANY TRADE. THIS DATA IS ONLY FOR EDUCATIONAL PURPOSE & PAPER TRADE. SHARE MARKET IS SUBJECT TO MARKET RISK. I AM NOT RESPONSIBLE FOR YOUR ANY LOSS OR PROFIT. Link to Join Telegram channel  -   https://t.me/chartworldat

NIFTY WEEKLY CHART ANALYSIS

Image
 NIFTY WEEKLY CHART ANALYSIS In the above chart we can see that price Perfectly touch the trend line resistance zone + Strong weekly closed above yellow zone + Now we can expect the price may hit the life high soon. Now last high of 12430.50 will act as strong resistance. In the above chart we can see that the price is trading above all important SMA. Nifty 50 Stocks List Company Name Adani Ports and Special Economic Zone Ltd. Asian Paints Ltd. Axis Bank Ltd. Bajaj Auto Ltd. Bajaj Finance Ltd. Bajaj Finserv Ltd. Bharat Petroleum Corporation Ltd. Bharti Airtel Ltd. Britannia Industries Ltd. Cipla Ltd. Coal India Ltd. Divi's Laboratories Ltd. Dr. Reddy's Laboratories Ltd. Eicher Motors Ltd. GAIL (India) Ltd. Grasim Industries Ltd. HCL Technologies Ltd. HDFC Bank Ltd. HDFC Life Insurance Company Ltd. Hero MotoCorp Ltd. Hindalco Industries Ltd. Hindustan Unilever Ltd. Housing Development Finance Corporation Ltd. ICICI Bank Ltd. ITC Ltd. Indian Oil Corporation Ltd. IndusInd Bank L

BANK NIFTY WEEKLY CHART ANALYSIS

Image
 BANK NIFTY WEEKLY CHART ANALYSIS  In the above chart we can see that Cup & Handle pattern breakout done on chart + Price perfectly touch the trend line resistance.  In the above chart we can see that Price closed above 200 SMA with strong candle. Also price is closed slightly above the 100 SMA . Bank Nifty Stocks List Axis Bank Ltd. Bandhan Bank Ltd. Bank of Baroda Federal Bank Ltd. HDFC Bank Ltd. ICICI Bank Ltd. IDFC First Bank Ltd. IndusInd Bank Ltd. Kotak Mahindra Bank Ltd. Punjab National Bank RBL Bank Ltd. State Bank of India DISCLAIMER : -  I AM NOT SEBI REGISTERED ANALYST. DO YOUR OWN ANALYSIS BEFORE TAKING ANY TRADE OR CONSULT YOUR ADVISER BEFORE TAKING ANY TRADE. THIS DATA IS ONLY FOR EDUCATIONAL PURPOSE & PAPER TRADE. SHARE MARKET IS SUBJECT TO MARKET RISK. I AM NOT RESPONSIBLE FOR YOUR ANY LOSS OR PROFIT. Link to Join Telegram channel  -   https://t.me/chartworldat